QI Analytics – Financials, Debtors & Creditors

Chart Financial Clarity with Dashboards.

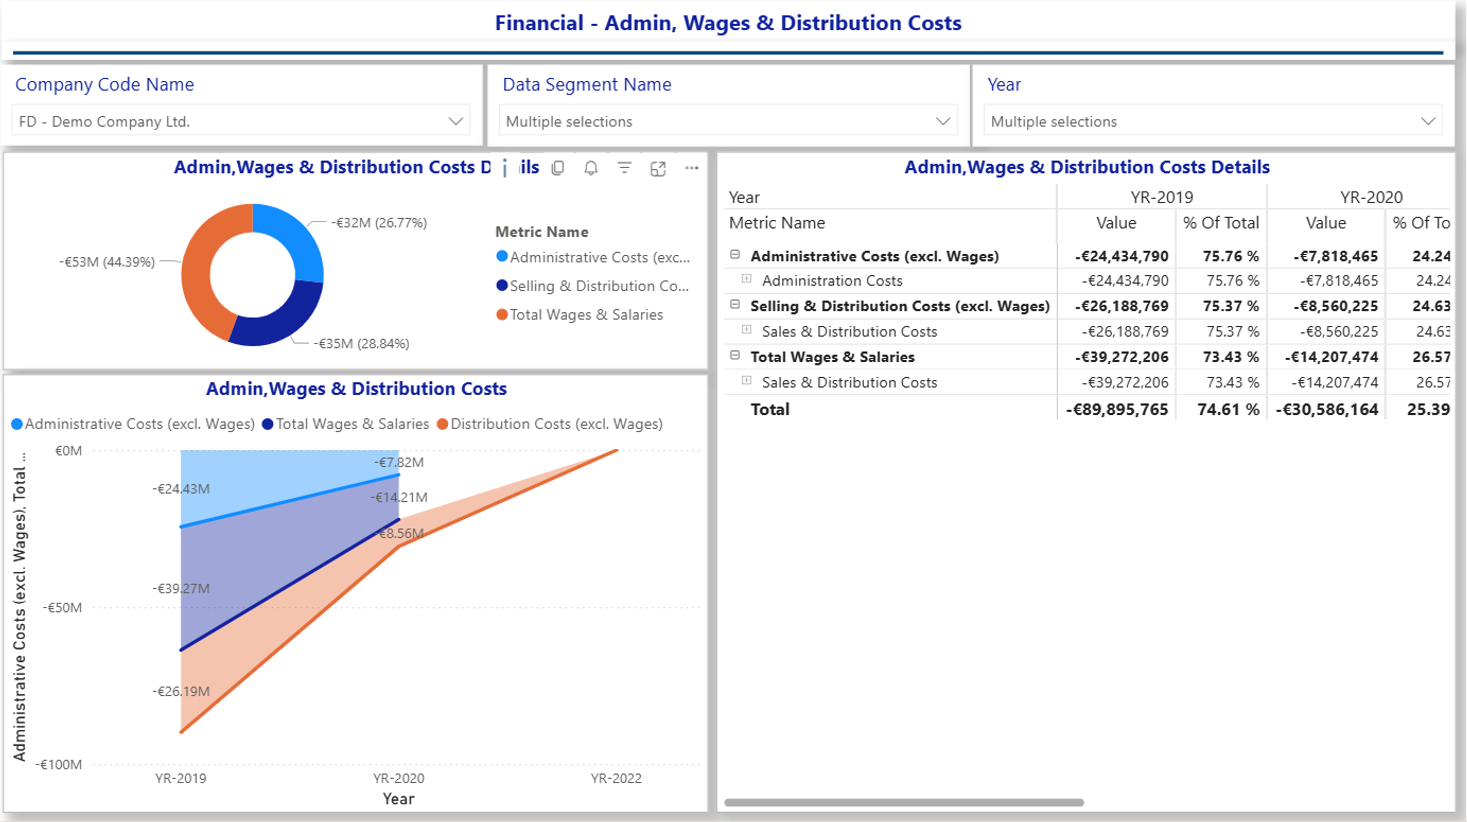
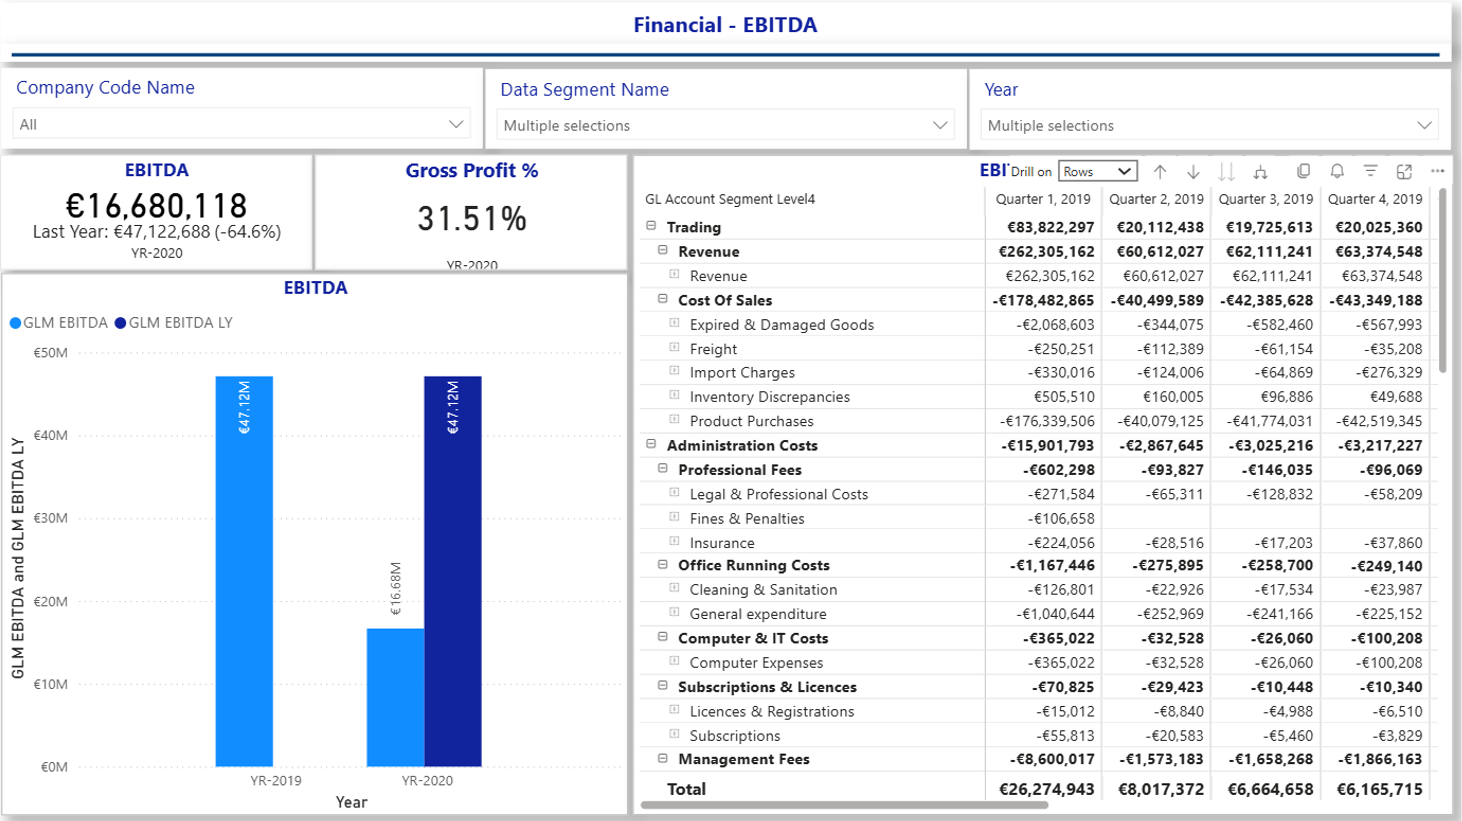
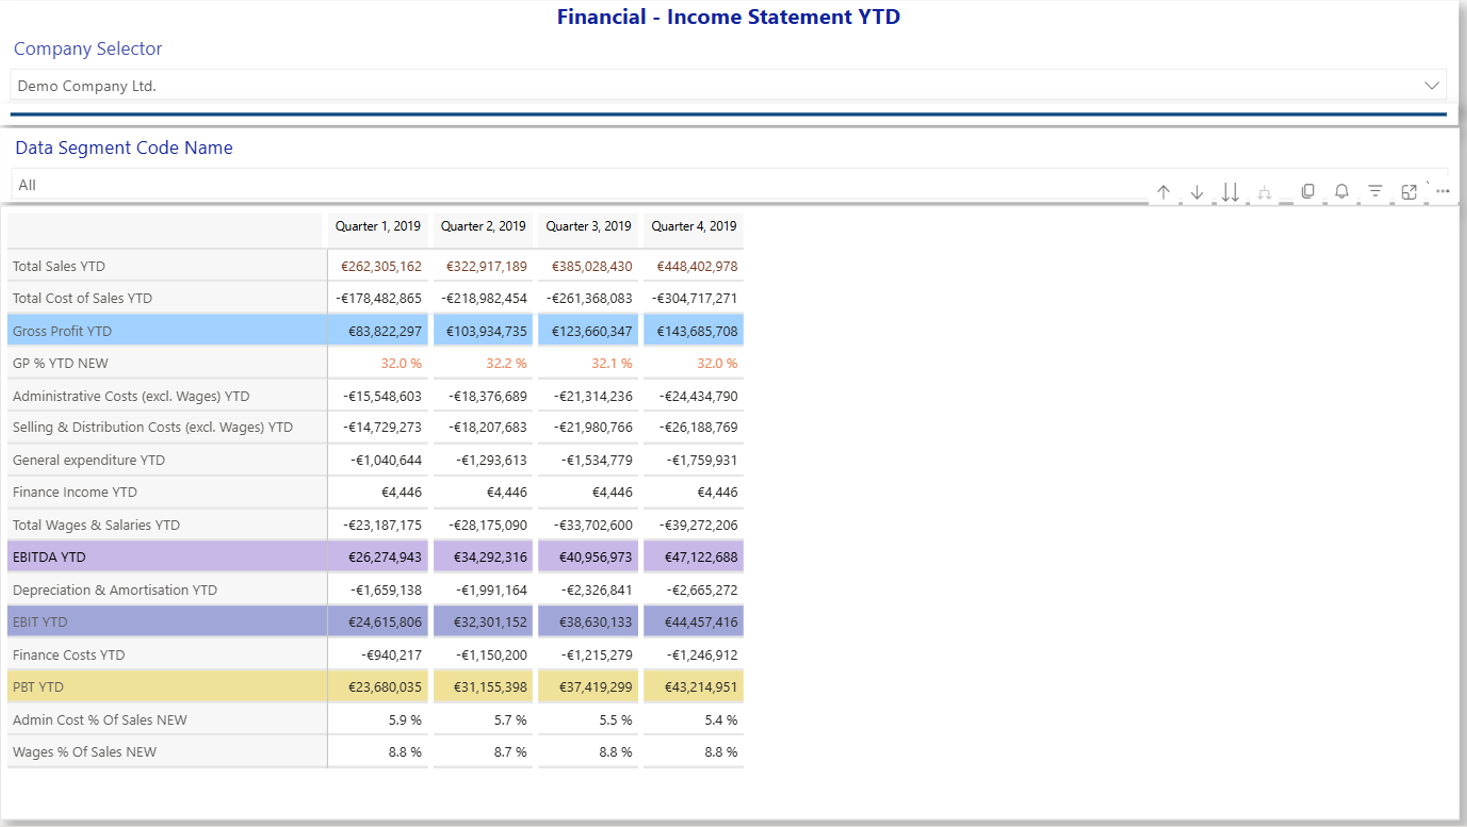
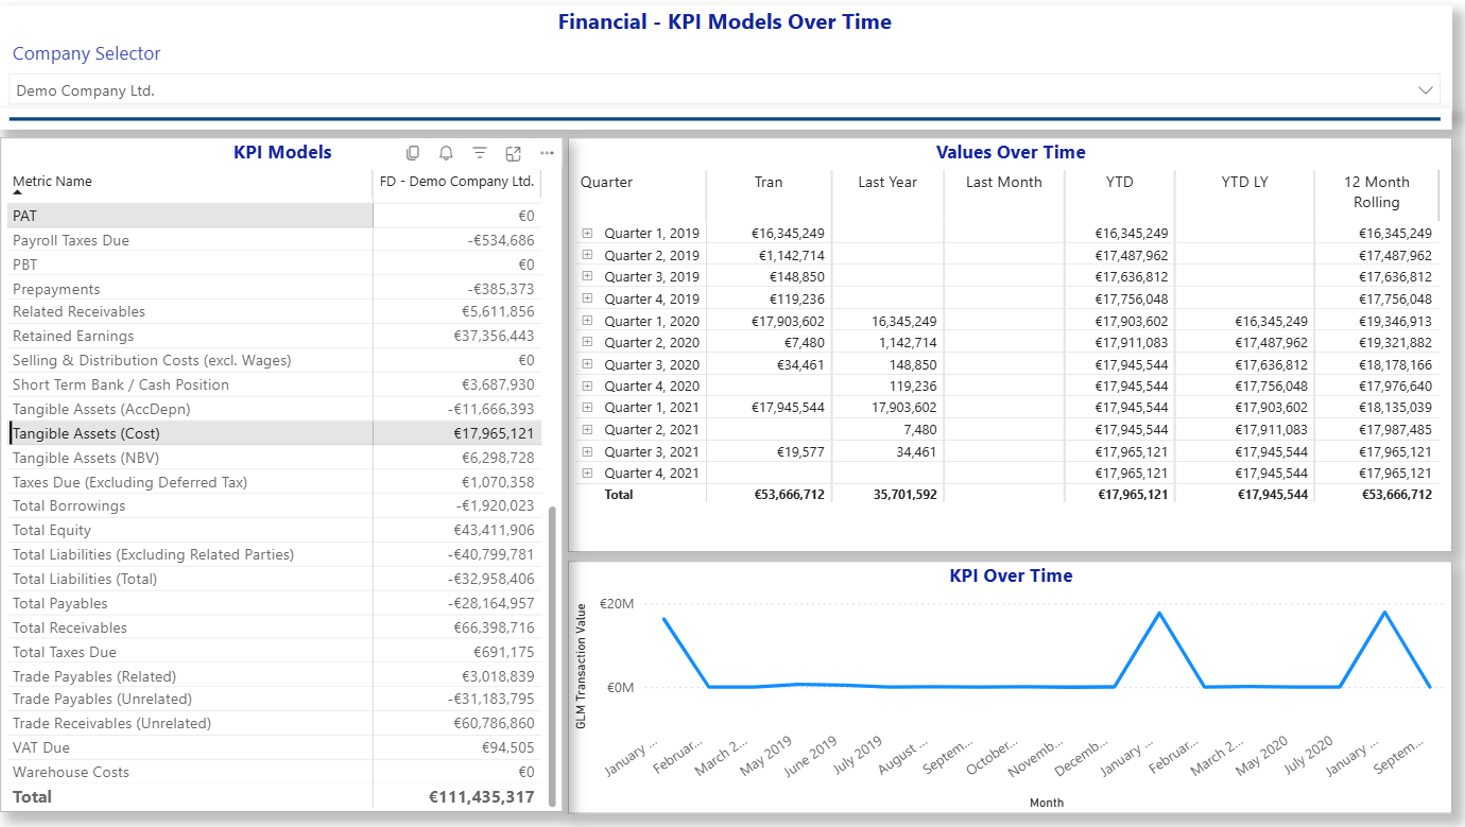
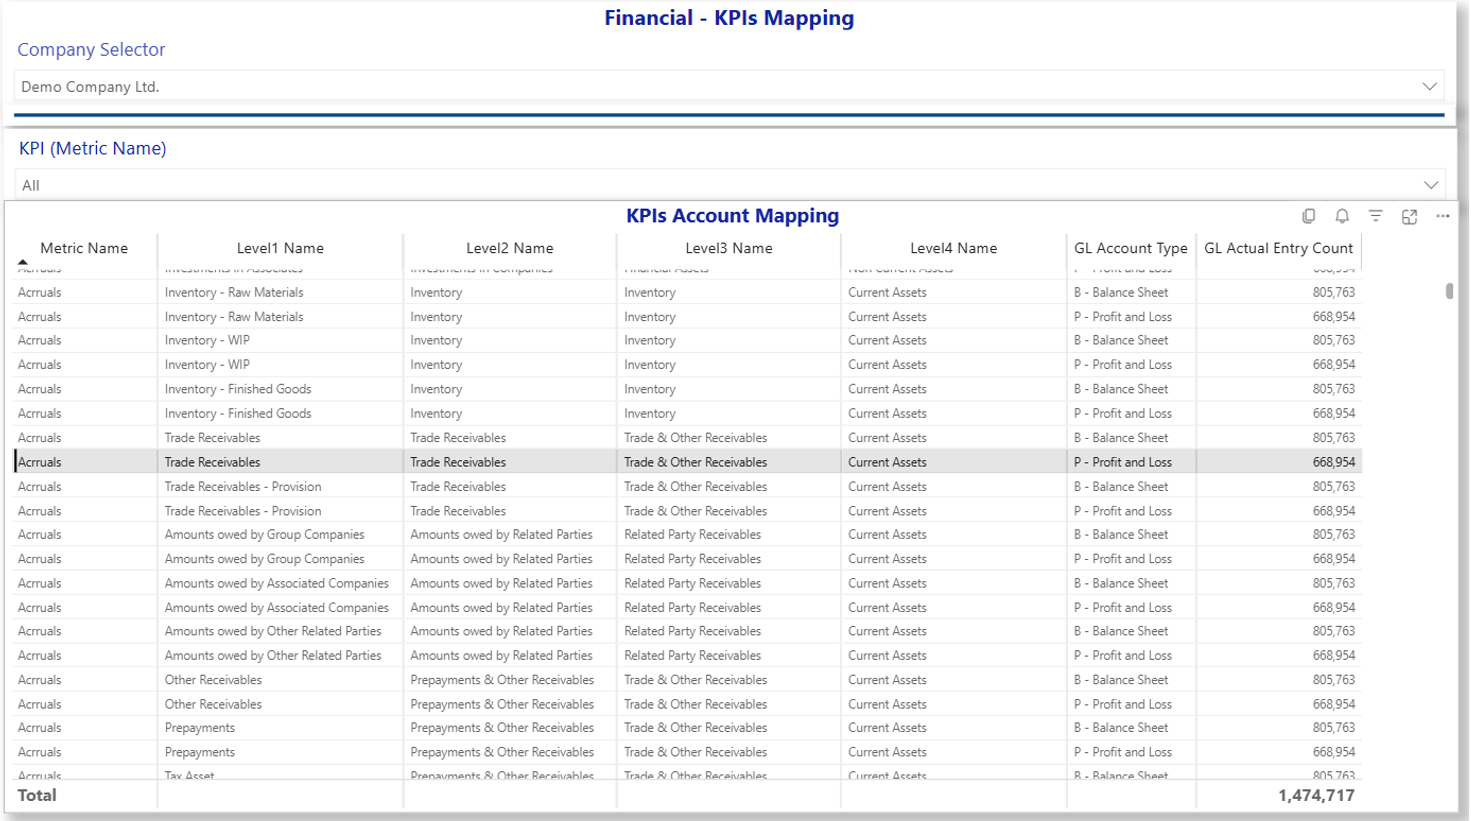
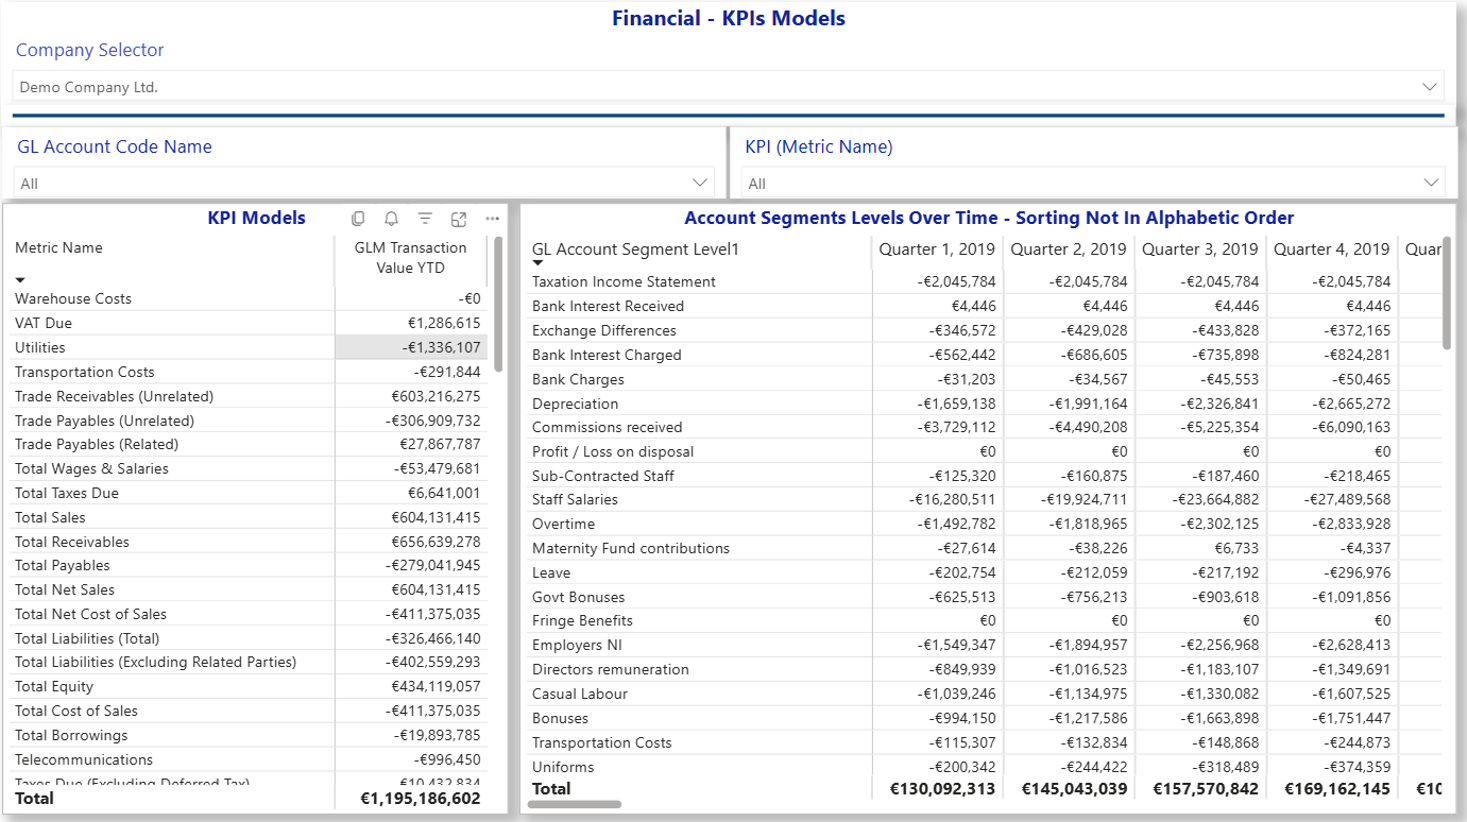
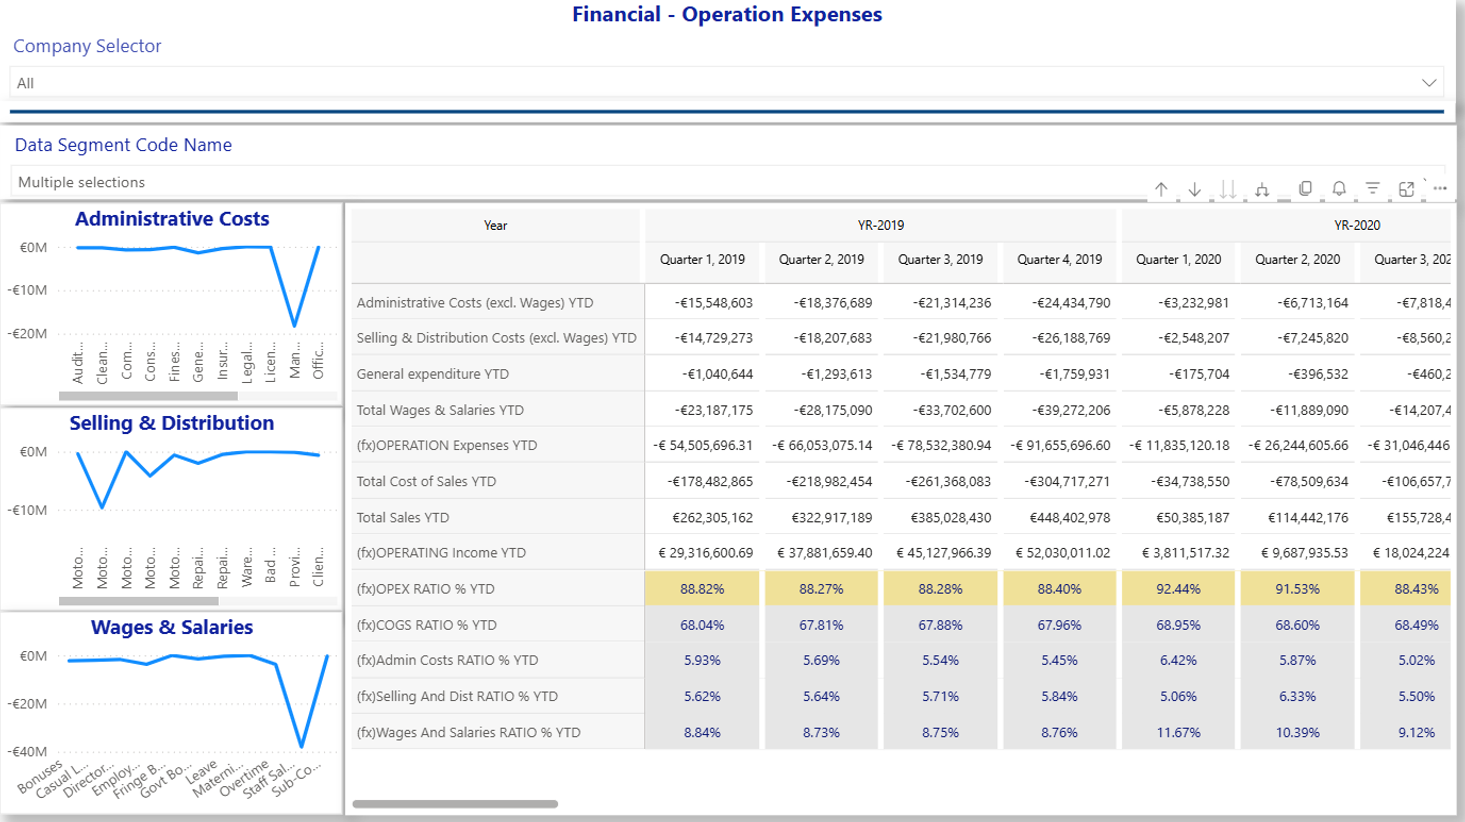
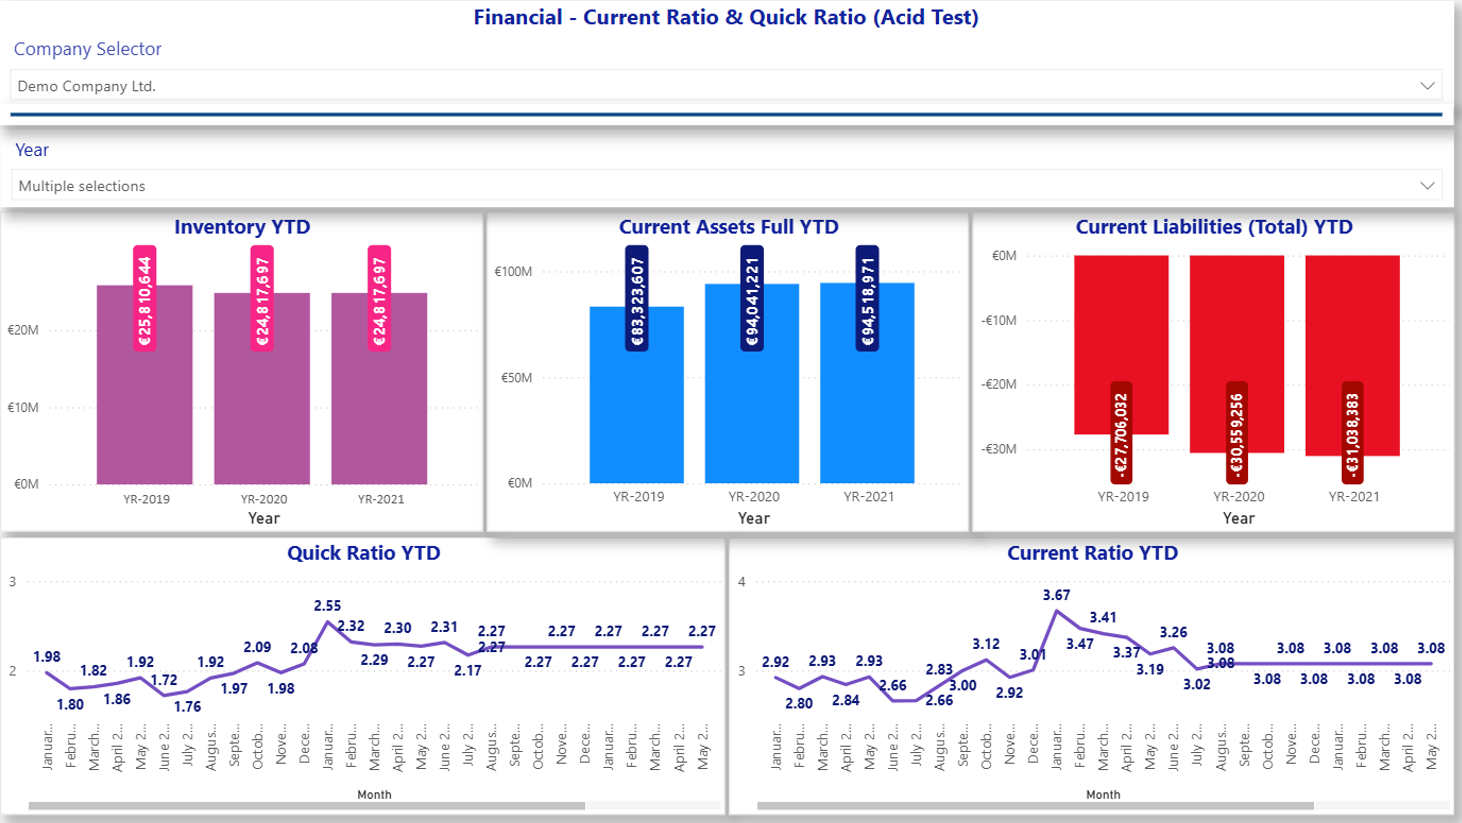
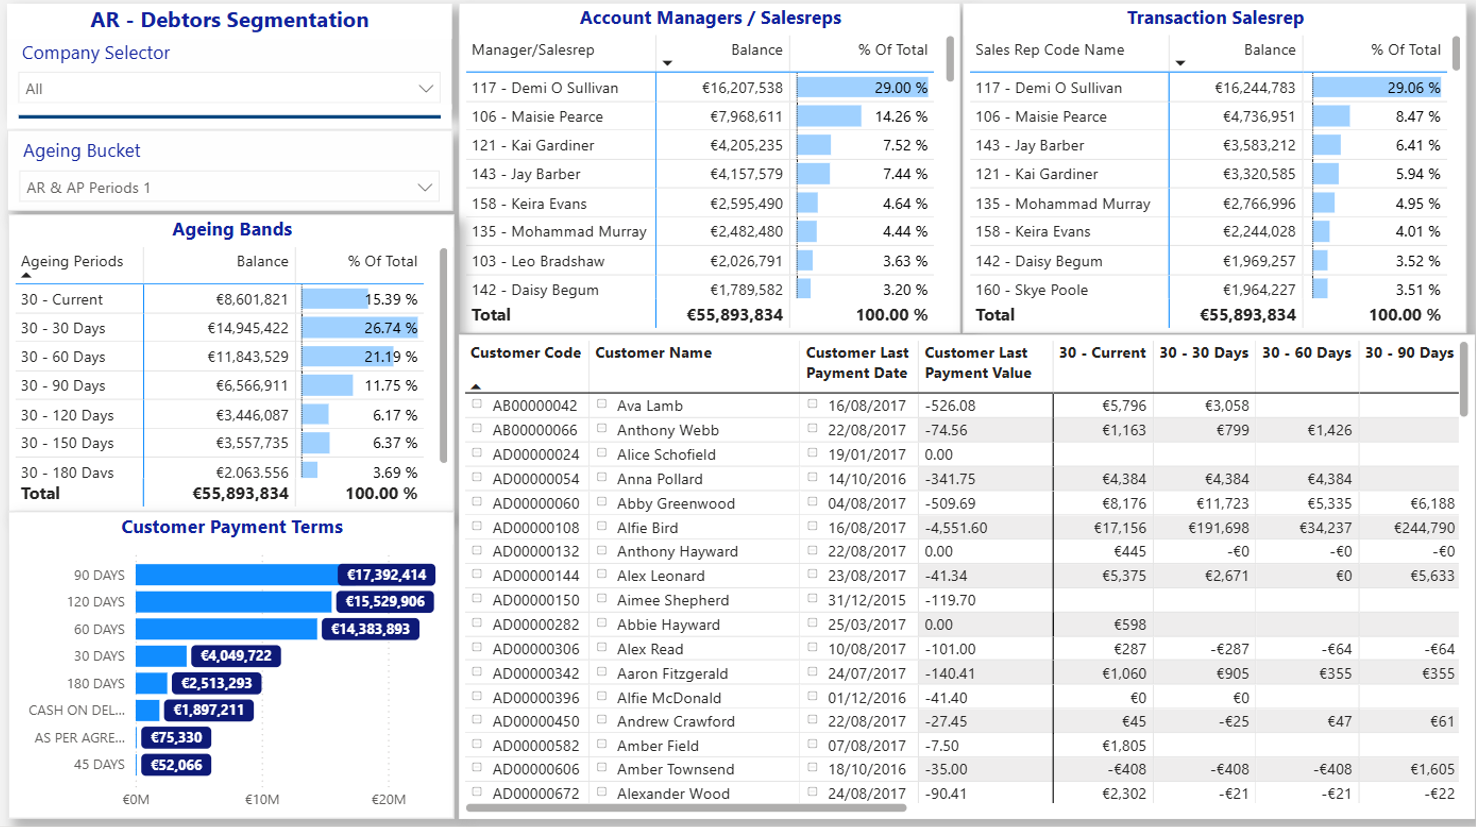
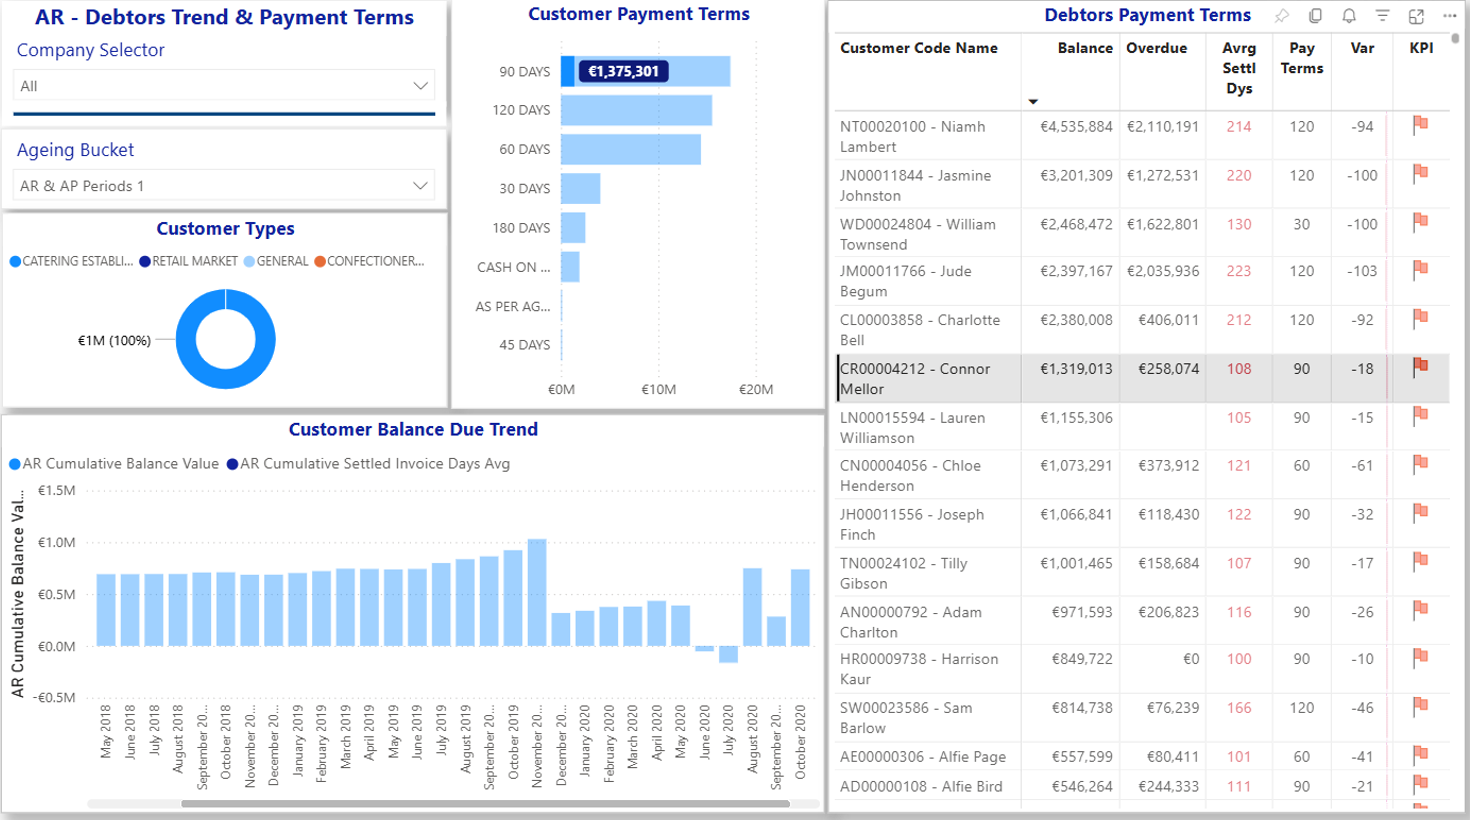
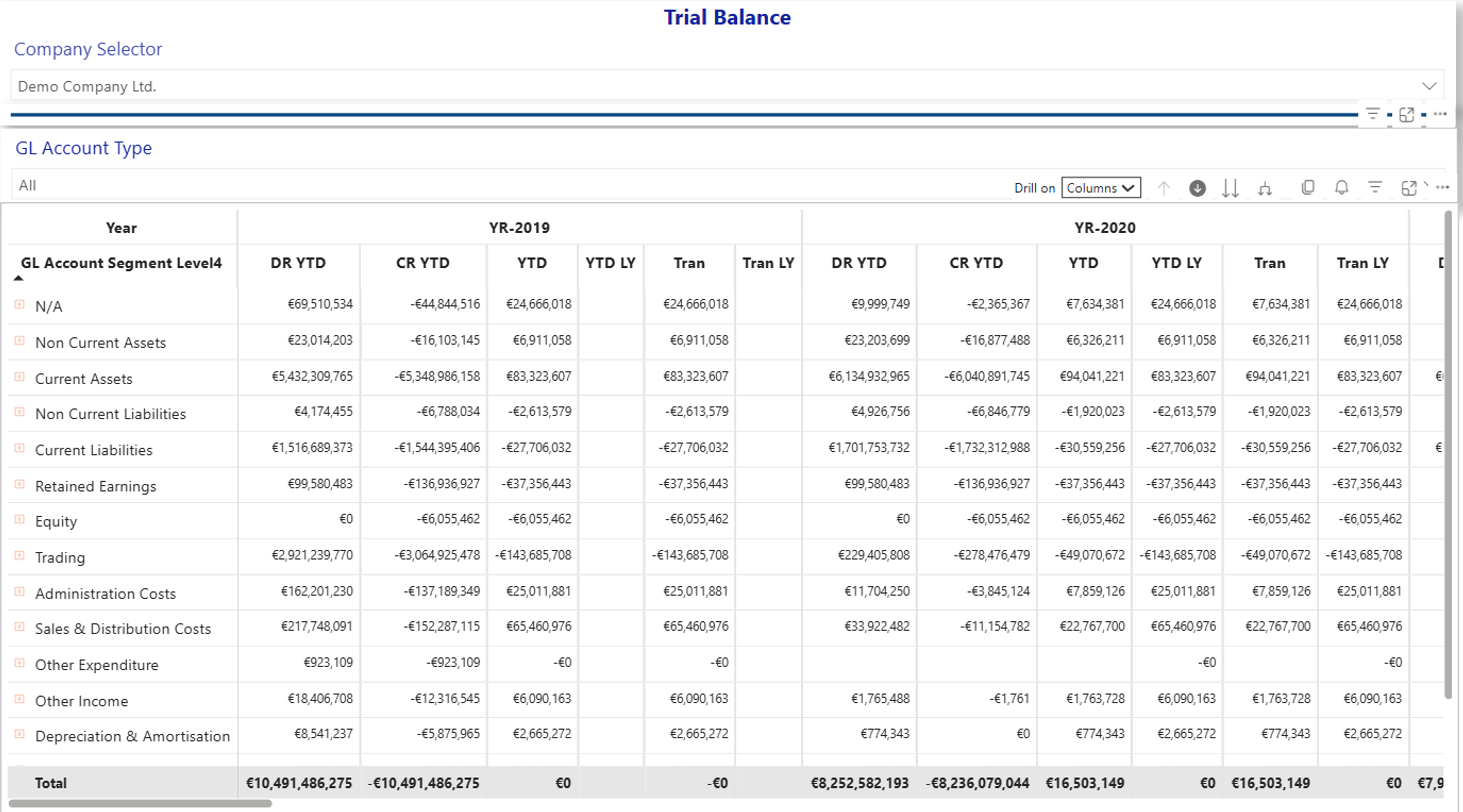
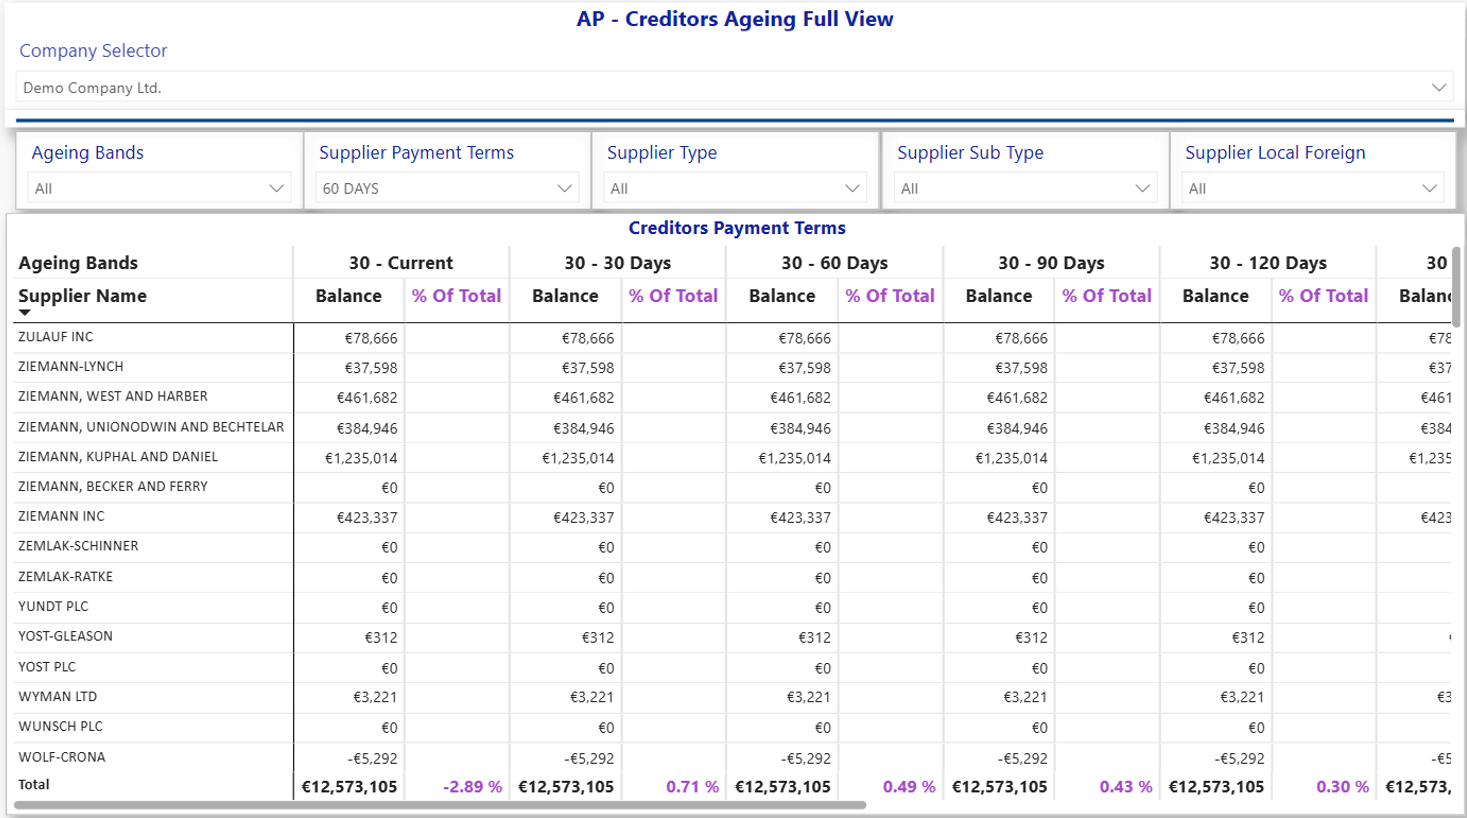
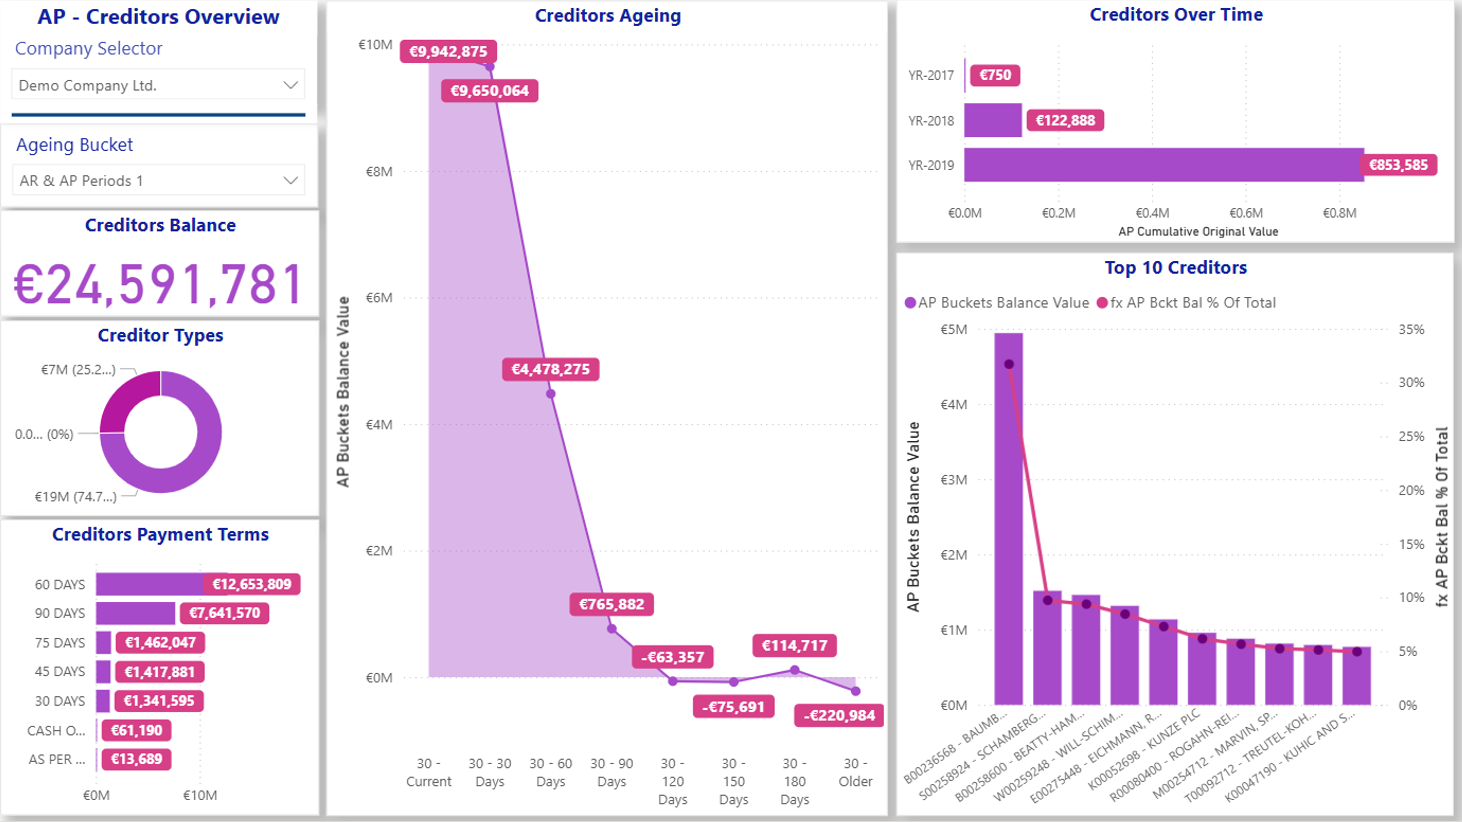
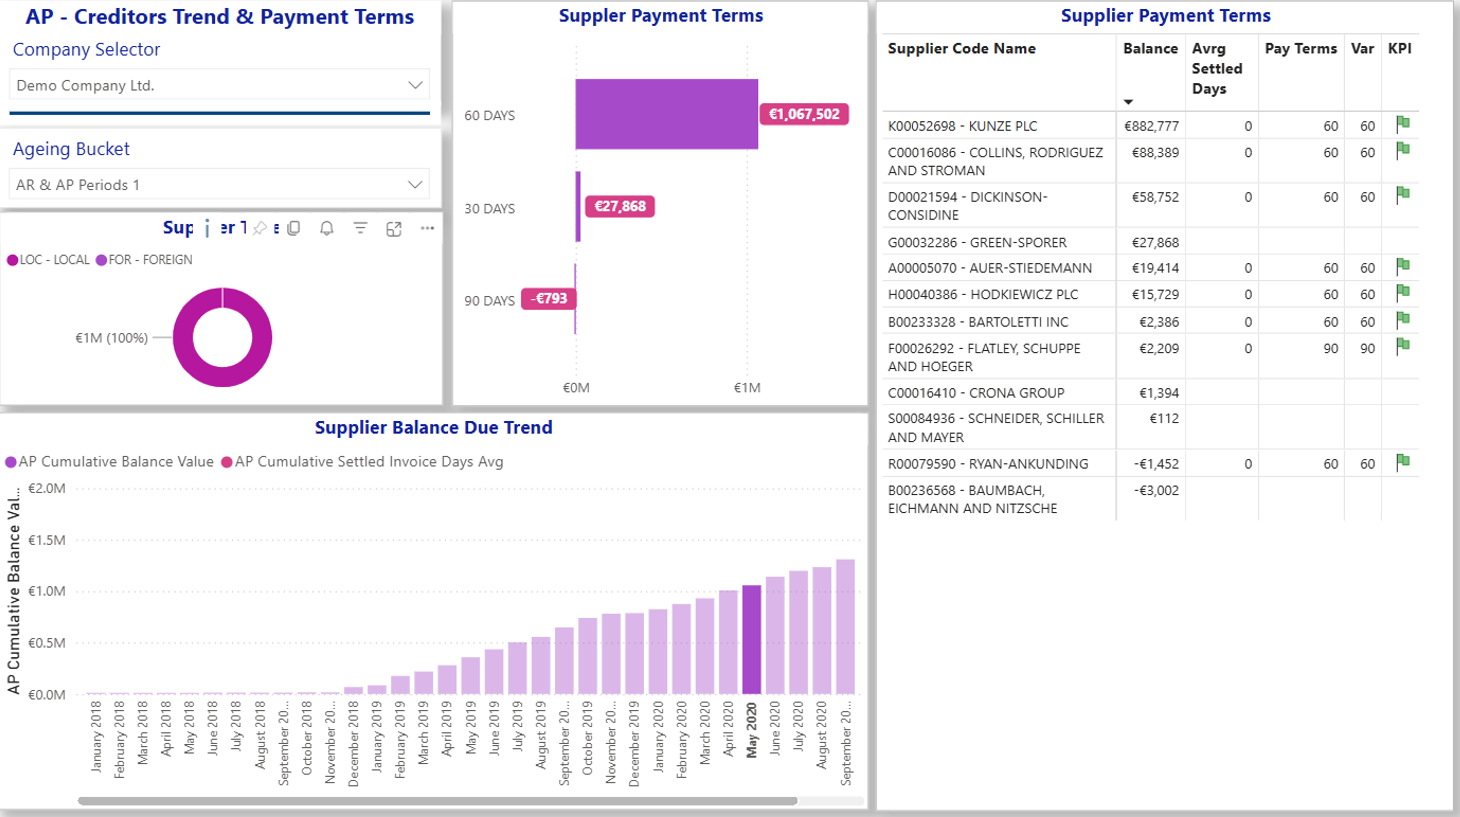
Today’s financial leaders need more than reports – they need vision. Our Financial BI Solution acts as a strategic compass for CFOs, controllers, and managers. With smart dashboards covering everything from balance sheetincome statement (profit and loss), to working capital and EBIT, you’ll uncover insights that guide capital allocation, risk assessment, and strategic forecasting. Drill from group-level summaries to account-level detail – all at speed.

Turn your data into a financial compass - steady, sharp, and always forward.

Tailored for Every Financial Trail.

In a world of shifting markets and performance pressure, visibility is your greatest advantage. From strategic management dashboards to granular transaction trails, every view is built for clarity. Our semantic layer architecture allows you to customise KPIs, create dynamic views, and define permissions based on role, division, or department. It’s not just a platform – it’s a financial data landscape you shape to suit your strategy.

Nominal Analytics.

  • Income Statement (Profit & Loss)
  • Balance Sheet, Trial Balance 
  • Four-level Hierarchy Chart of Account Structure
  • View Over Months Spanning Across Years
  • Cumulative View Over Months Across Years
  • Drillable Trial Balance Through Hierarchical Levels Down to Individual Account
  • Dashboard-Ready for Clear Account Presentation
  • Quick Ratio, EBIT, Equity, Working Capital
  • Drillable GL Dashboards per Department or Division

Debtors Analytics.

  • Debtors Overview
  • Debtors Trends Over Time
  • Debtors Segmentation
  • Accounts Receivable Analytics

Creditors Analytics.

  • Accounts Payable Dashboards
  • Creditors Ageing Overview
  • Creditor Trends Over Time

From Transactions to Trajectory.

Every transaction tells a story, but when woven into financial reporting, sales data reveals the bigger journey – growth trajectories, regional momentum, and the true impact of promotions. By uniting sales analytics with financial dashboards, you see how customer behaviour translates into sustainable revenue and long-term profitability.

Explore Sales BI

From Stock to Strategy.

Behind every balance sheet figure lies the rhythm of inventory – what’s moving, what’s stalled, and what’s driving working capital. When financials and inventory analytics are connected, leaders gain foresight into cost efficiency, margin protection, and cash flow resilience. It’s not just stock control – it’s strategic alignment with your financial future.

Explore Inventory BI

Want to learn more?